
 9.5
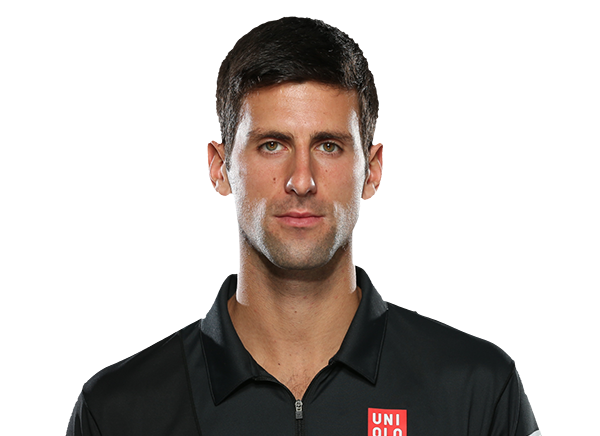
Novak Djokovic
 ATP Tour
Relevance2nd in league · 2nd in sport · 194th in world
Social Impressions412.8MPage Views4.1MYoY Momentum75% 🔥🔥
Rankings Across Categories
league rank · tap for raw · percentile · grade · sport / globalRanked within ATP Tour · tap any category for raw value, percentile, grade and league / sport / global ranks.
Performance
value · rank · percentile · grade — all within-leagueBox score
Ranked among 126 qualified ATP Tour players · per match / career
| Titles | Wins | Ace/Gm | 1st Srv% | 1st Win% | BP Save% | BP Conv% | |
|---|---|---|---|---|---|---|---|
| Value | 101 | 1170 | 0.578 | 67 | 76.3 | 55.2 | 45.3 |
| Rank | #1 | #1 | #44 | #10 | #17 | #96 | #3 |
| Pctl | 100 | 100 | 66 | 93 | 87 | 25 | 98 |
| Grade | A+ | A+ | C | B+ | B | D+ | A |
Advanced
Ranked among 126 qualified ATP Tour players · per match / career
| Elo† | Serve Rtg | Return Rtg | Dominance† | Tiebreak%† | |
|---|---|---|---|---|---|
| Value | — | 281.8 | 151.8 | — | — |
| Rank | — | #12 | #6 | — | — |
| Pctl | — | 91 | 96 | — | — |
| Grade | — | B+ | A- | — | — |
† Elo — no Elo model in the tennis feed
† Dominance — needs per-match serve/return points
† Tiebreak% — tiebreak splits not in the feed
Attention KPIs
Wikipedia + social, last 12 monthsWiki Views
Wiki views / yr
4.1M
All-time search
62.7M
Stabilized / yr
2.8M
90-day views
1.5M
Spike views
1.3M
Over expected
−1.5M
Social
Social viewers
141.5M
TV audience
173.3M
Unique reach
192.2M
Momentum
Momentum
41.7%
Momentum vs league
#51
Year over year
107.0%
Week heat
#16
Month heat
#53
Year heat
#52
VOE week
−31.3K
VOE month
−108.8K
VOE year
−1.5M
Earnings & Business
annual estimates · actual salary where knownSalary
$1.8M
actual
% of Team Payroll
—
Endorsement
$20.3M
Endorse % of Earnings
92%
Earnings Estimate
$22.1M
salary + endorsements
Earnings rank #78 global· #1 tennis· marketability #119
Awards Race
MVP odds
—
MVP rank
—
Champ equity
—
Teammates & Front Office
top 7 by Q score · plus coachSeason by Season
calendar years · team as it was| Year | Team | Views | Y/Y | Rk Sport | Rk Global | Social |
|---|---|---|---|---|---|---|
| 2026partial | — | 3.4M | -16.0% | #3 | #27 | 519.8M |
| 2025 | — | 5.6M | -23.8% | #4 | #15 | 572.7M |
| 2024 | — | 7.4M | -38.7% | #1 | #14 | 683.9M |
| 2023 | — | 12.1M | +86.2% | #1 | #6 | 954.9M |
| 2022 | — | 6.5M | -9.7% | #3 | #16 | 545.1M |
| 2021 | — | 7.2M | +105.2% | #2 | #9 | 584.1M |
| 2020 | — | 3.5M | -44.4% | #2 | #40 | 338.9M |
| 2019 | — | 6.3M | +53.2% | #3 | #11 | 496.3M |
| 2018 | — | 4.1M | +44.7% | #5 | #35 | 350.7M |
| 2017 | — | 2.8M | -36.5% | #5 | #52 | 264.8M |
| 2016 | — | 4.5M | +53.9% | #2 | #26 | 368.6M |
| 2015partial | — | 2.9M | — | #3 | #17 | 254.0M |
GOAT tracker
Coming soon